Status: Active development (MVP in progress). This page reflects the current blueprint, MVP scope, and targets; some items are in-flight.
Project Snapshot
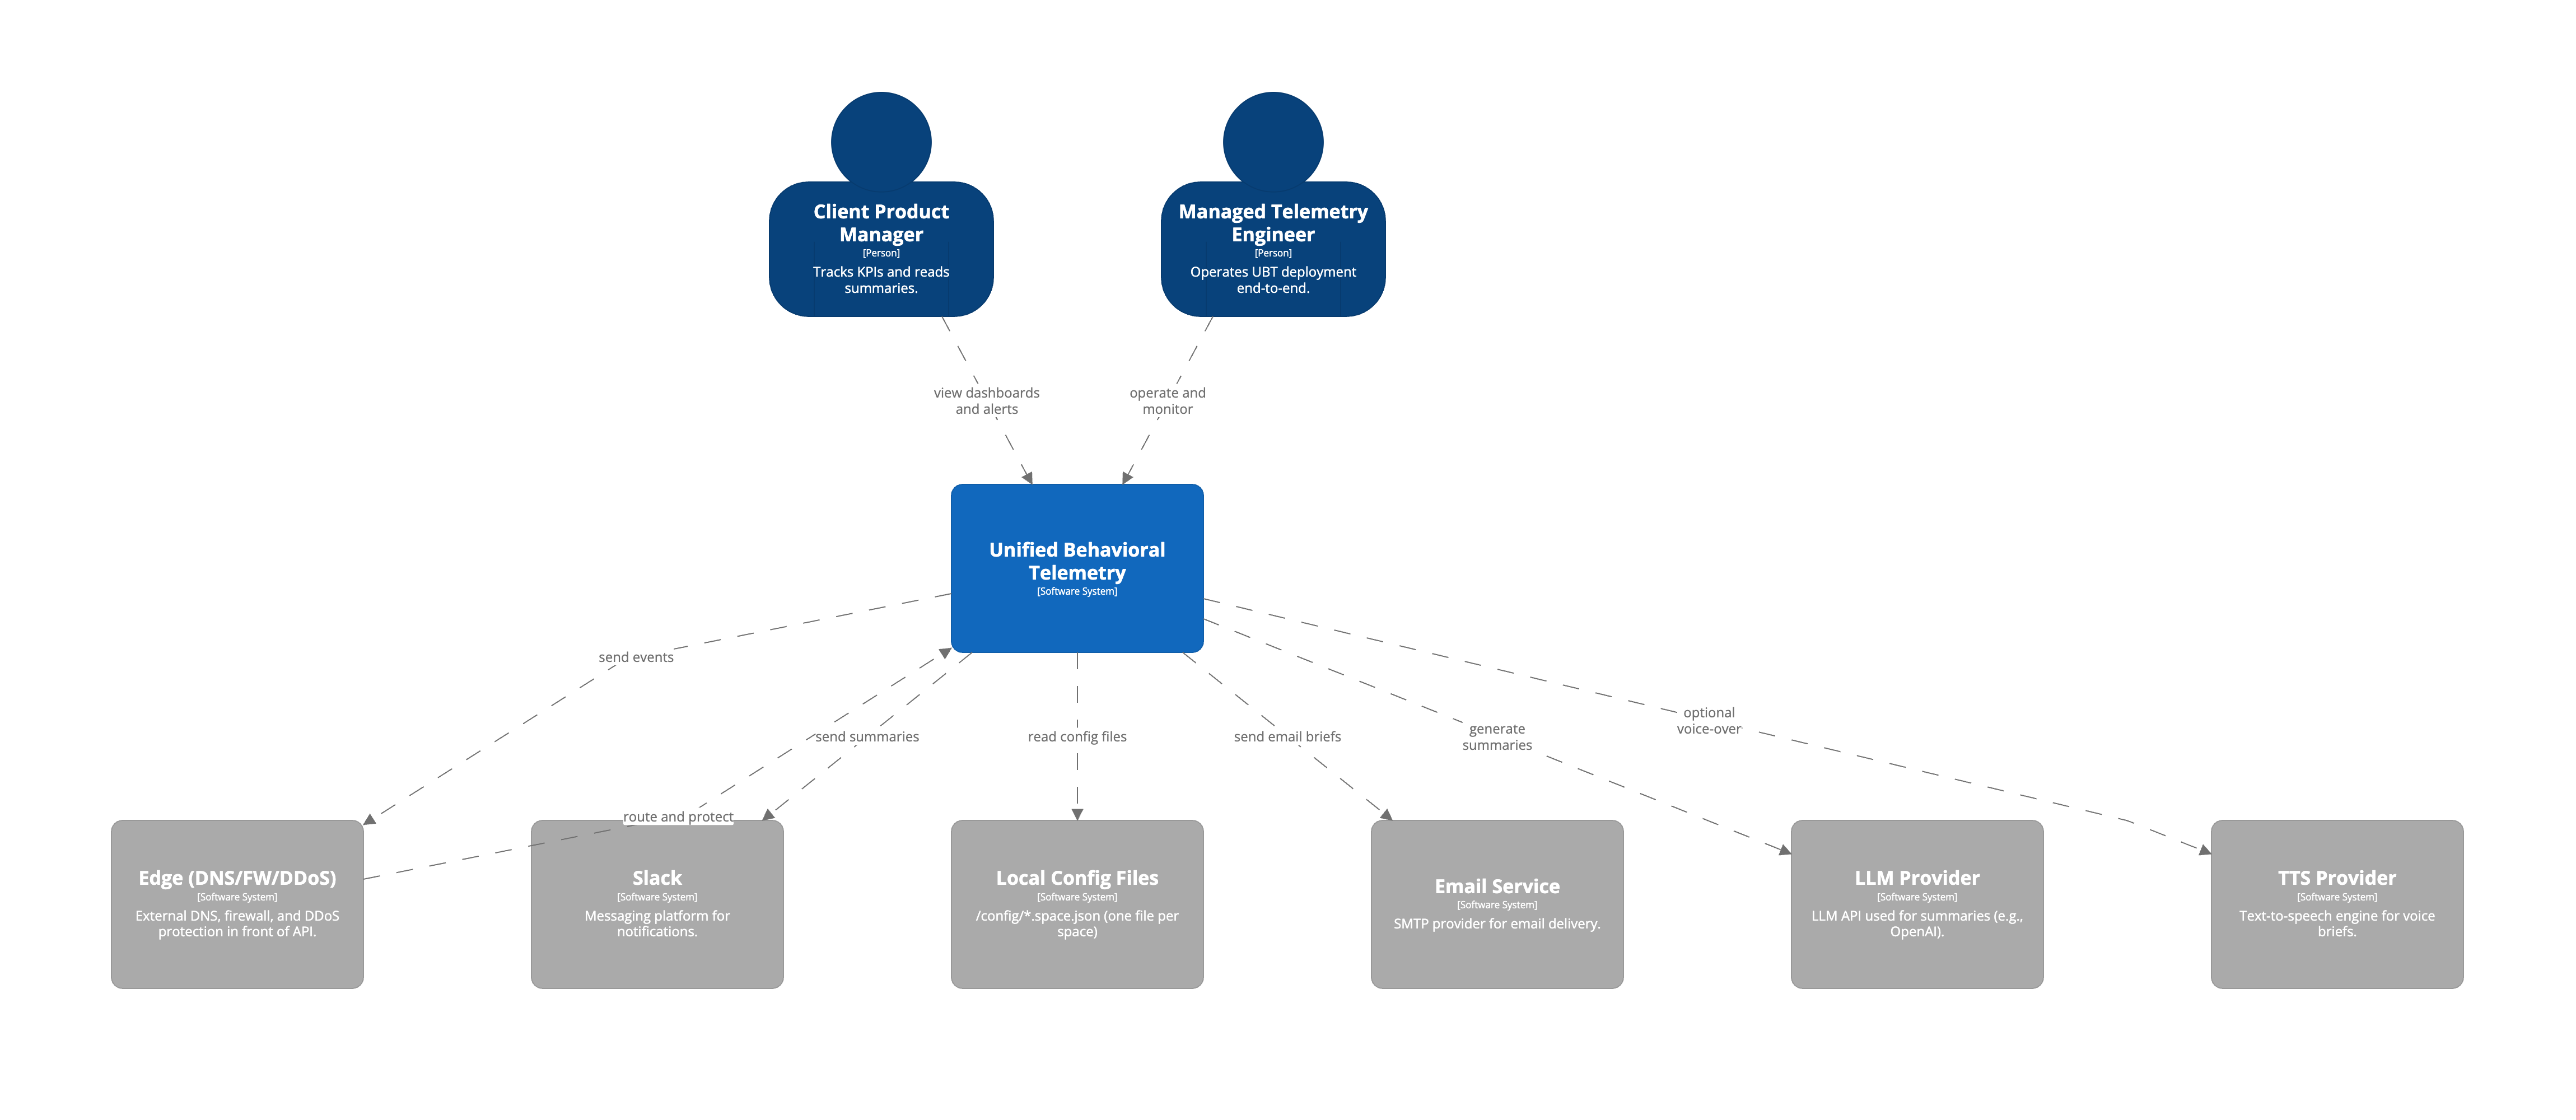
Unified Behavioral Telemetry (UBT) is an open, opinionated blueprint for behavioral data pipelines. It unifies ingestion, enrichment, storage, and visualization across web, mobile, and IoT—designed to be AI‑ready and cost‑efficient from day one. One deployment supports multiple independent “spaces” (e.g., clickstream, IoT, ML feedback) with shared infrastructure but isolated schemas, access, and dashboards. Baseline stack: Node.js collectors and services, Kafka + Schema Registry (+ DLQ), ClickHouse for real‑time aggregates, and Grafana for visualization. Target infra cost is <$4 per 1M events with sub‑2‑minute ingestion‑to‑dashboard latency.
Problem Context
Teams repeatedly rebuild telemetry for apps and devices, ending up with fragmented tools, inconsistent event contracts, vendor lock‑in, and rising cost. Even worse, data is often not AI‑ready—locked in products, under‑modeled, or too slow/expensive to use for summarization and anomaly notes. UBT addresses this with open components, consistent contracts, space isolation, and curated models that make behavioral data ready for dashboards and AI use cases.
Key Technical Challenges
- Consistent instrumentation (JS/mobile/firmware) with versioned, validated schemas and CI checks.
- Space isolation and governance: namespaces, ACLs, retention, quotas, and dashboard scoping.
- Short‑lived auth (ES256/RS256 JWT) with per‑space keys and simple edge protections.
- Sub‑2‑minute aggregates at predictable cost; replay and DLQ workflows that are safe to operate.
- PII minimization/masking, lineage, and auditability without heavy operational overhead.
- Interoperable tracks: DIY Docker and an AWS‑native option while keeping schemas and dashboards shared.
Solution Architecture
Event‑driven pipeline with opinionated defaults (schemas, topic naming, materialized views, dashboards) and space‑level configuration files (/config/<space>.space.json). Collectors batch events to an API behind an edge; the API validates short‑lived tokens and publishes to Kafka topics per space with Schema Registry enforcement and DLQs. A Runner service executes enrichment (PII masking, geo/device joins), storage writer (ClickHouse inserts with partitioning/TTL), and the AI Narrator (weekly summaries/voice briefs). Grafana dashboards sit on curated ClickHouse views; replay/export endpoints support ad‑hoc analysis and backfills.
Technology Highlights (Planned/Alpha)
- Instrumentation kit: JS/mobile guidance + firmware event template; schema contracts + validation.
- API Service + collectors with batching, backpressure, and short‑lived JWT auth (per space).
- Kafka backbone with Schema Registry, topic conventions, DLQ, and replay tools.
- Runner jobs: enrichment (PII masking, geo/device joins), storage writer (ClickHouse), AI Narrator.
- ClickHouse materialized views for sessions, funnels, retention cohorts, and device health.
- Grafana dashboard packs with alerts; curated views target <5s panel latency.
- IaC modules for DIY (Docker/Terraform) and AWS‑native tracks; shared schemas/dashboards across both.
- Governance: space isolation, ACLs, retention, audit logs, and schema compatibility gates in CI.
Target Outcomes
- First useful dashboards within two weeks from kick‑off (clickstream and IoT spaces).
- Ingestion‑to‑dashboard p50 < 2 minutes for top aggregates.
- Infra cost baseline under $4 per 1M events (storage + compute), with tuning guidance.
-
95% schema‑validated events; clear DLQ/replay playbooks and CI compatibility checks.
- Space isolation by default: namespaces, ACLs, per‑space retention and dashboards.
- AI Narrator “Exec Brief” available weekly (text + optional voice note) per stakeholder.
MVP Scope (Phase‑1)
- One deployment serving multiple spaces (clickstream, IoT, ML feedback).
- Short‑lived JWT auth per space (ES256/RS256) + JWKS; edge protections.
- Kafka + Schema Registry + DLQ; ClickHouse storage with partitioning/TTL; Grafana dashboards.
- Opinionated defaults: topic naming, schemas, materialized views, dashboards and alert templates.
- Export/replay endpoints; backfill runbooks; CI checks for schema compatibility.
KPIs & Measurement
- Latency (ingestion → dashboard): p50/p95.
- Cost per 1M events (infra proxy); vendor spend share trending down.
- Schema validation pass rate; DLQ rate; replay success.
- Pipeline availability (ingestion + storage) and query performance.
- AI readiness and usage: Narrator adoption and summary accuracy.